The viewer
freedyn2 view model.yaml                    # simulate and show; again after every save
freedyn2 view model.yaml result.csv         # show these results
freedyn2 view model.yaml --no-run           # the model at t = 0
freedyn2 view model.yaml -- --end-time 2    # options for the solver after --
freedyn2 view model.yaml --export page.html # one HTML file to pass on (no server needed)
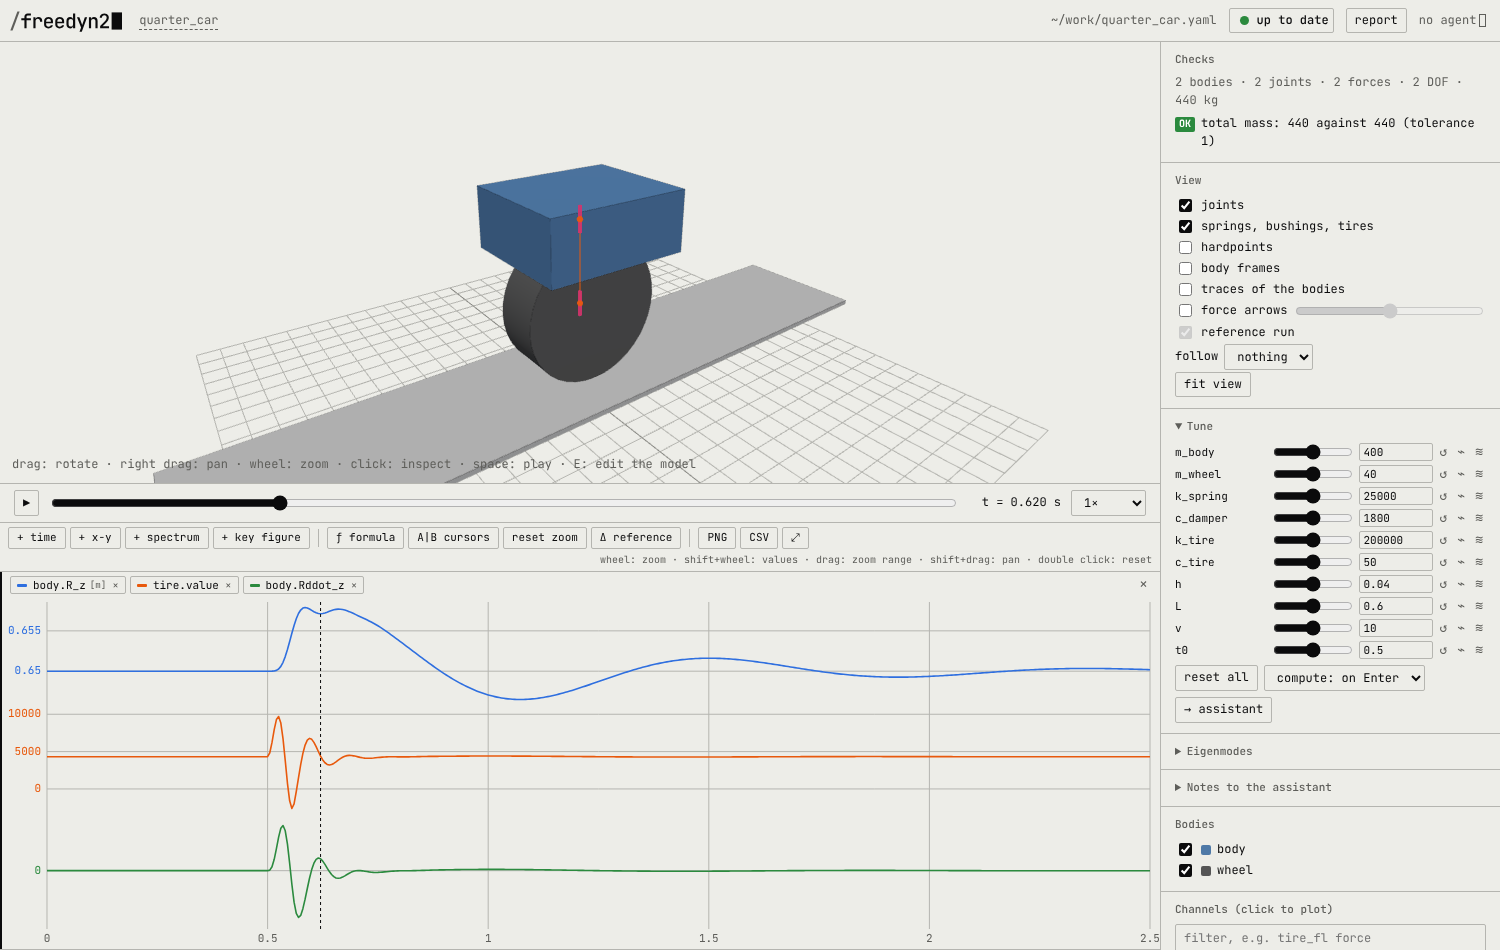
The viewer is a page in your browser, served on http://127.0.0.1:8765/ (--port). It works
offline. Every save of the model file – by you, in any editor, or by an assistant – rebuilds
and simulates again; an invalid model is reported over the last valid one, so you can keep
editing with the viewer open.
The app
freedyn2-gui                  # the start page (on Windows: the freedyn2 shortcut, no console)
freedyn2-gui model.fds        # open a model (also: a double click on a model file)
freedyn2 gui [model ...]      # the same from a console; --browser: in the web browser
freedyn2-gui is freedyn2 as a desktop program around the same viewer. With
pywebview (pip install "freedyn2[gui]"; WebView2 on
Windows, GTK or Qt on Linux) the start page and every opened model get a window of their own,
titled freedyn2; without it, or with --browser, they open in the default web
browser. Closing the last window ends the program (in the browser: Quit on the start page, or
a few minutes after the last tab was closed).
The start page offers:
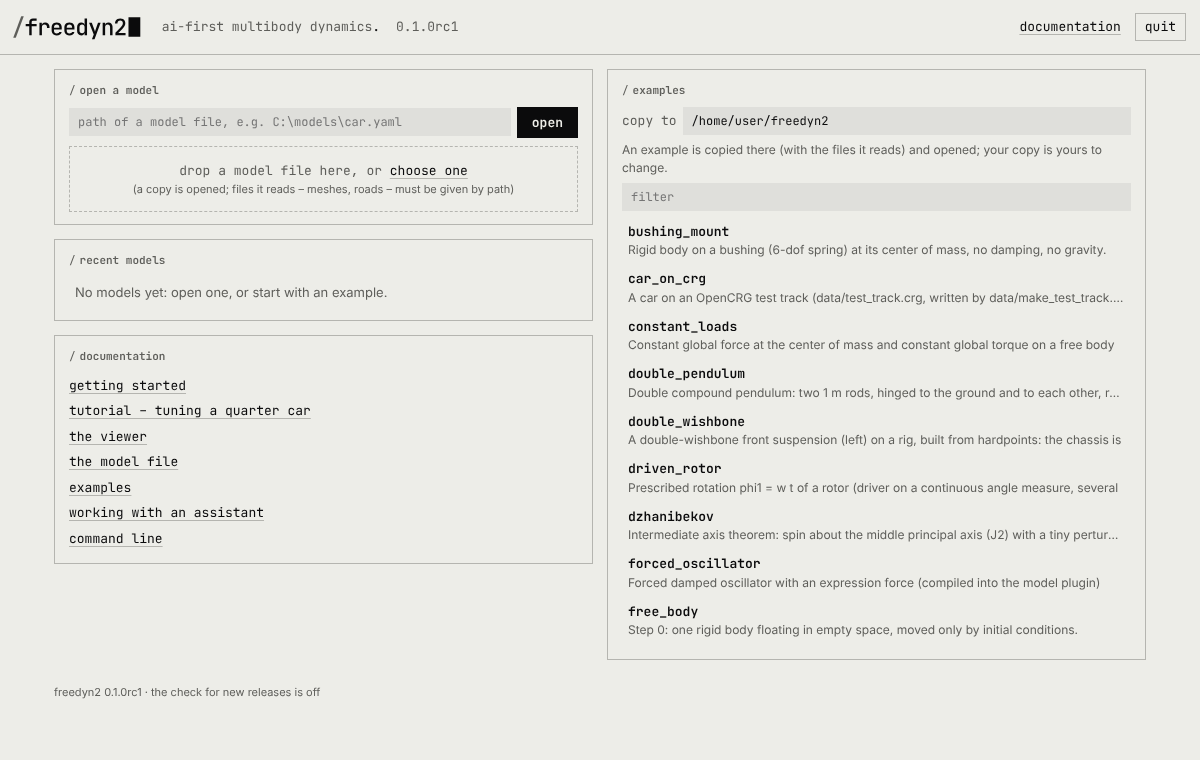
- Open a model: a
.yamlor legacy.fdsfile, with the file dialog of the system (app window), or by its path, or dropped onto the page (browser; a dropped file is opened as a copy, so files it reads – meshes, roads – must be given with absolute paths). - Recent models, the newest first (kept in the per-user data folder,
recent.json). - Examples: a click copies the example, with the files it reads, into a folder you choose
(default
Documents\freedyn2; files already there are kept) and opens your copy. - Documentation: links to this site.
Only one app runs per user: a second start – a double click on another model file – hands the
file to the running app, which opens it in a new window. The app writes its log to
freedyn2.log in the per-user log folder (Windows %LOCALAPPDATA%\freedyn2\logs, Linux
~/.local/share/freedyn2/logs); errors are shown on the page and in a dialog. Each model
window is the viewer described below, unchanged; it simulates again on every save of the file,
as freedyn2 view does.
Update notice
At start the app asks GitHub, at most once a day and in the background, whether a newer
release is out. If so, the start page and the viewer windows show a small notice freedyn2
X.Y.Z is available with a link to the
release page. Nothing is downloaded
or installed; without a network nothing is shown. freedyn2 update-check asks right away and
prints the answer.
To turn the check off, set "update_check": false in config.json of the per-user settings
folder (Windows %APPDATA%\freedyn2, Linux ~/.config/freedyn2), or the environment
variable FREEDYN2_NO_UPDATE_CHECK=1.
3D view and timeline
- Drag to rotate, right-drag to pan, wheel to zoom; fit view; follow a body (a model that drives away is followed by itself).
- Space plays, the arrow keys step, the speed menu slows down or speeds up.
- Bodies are drawn with their shapes, or as the box of their mass and inertia if they have none; joints, springs, bushings and tire contacts are marked. View shows body frames, traces, force arrows (forces red, torques purple, scaled to the largest of the run) and the reference run.
- Click an element to inspect it: its data, its result channels (click to plot), its findings and its YAML text with the line in the model file. What it is connected to stays, the rest fades.
Edit the model
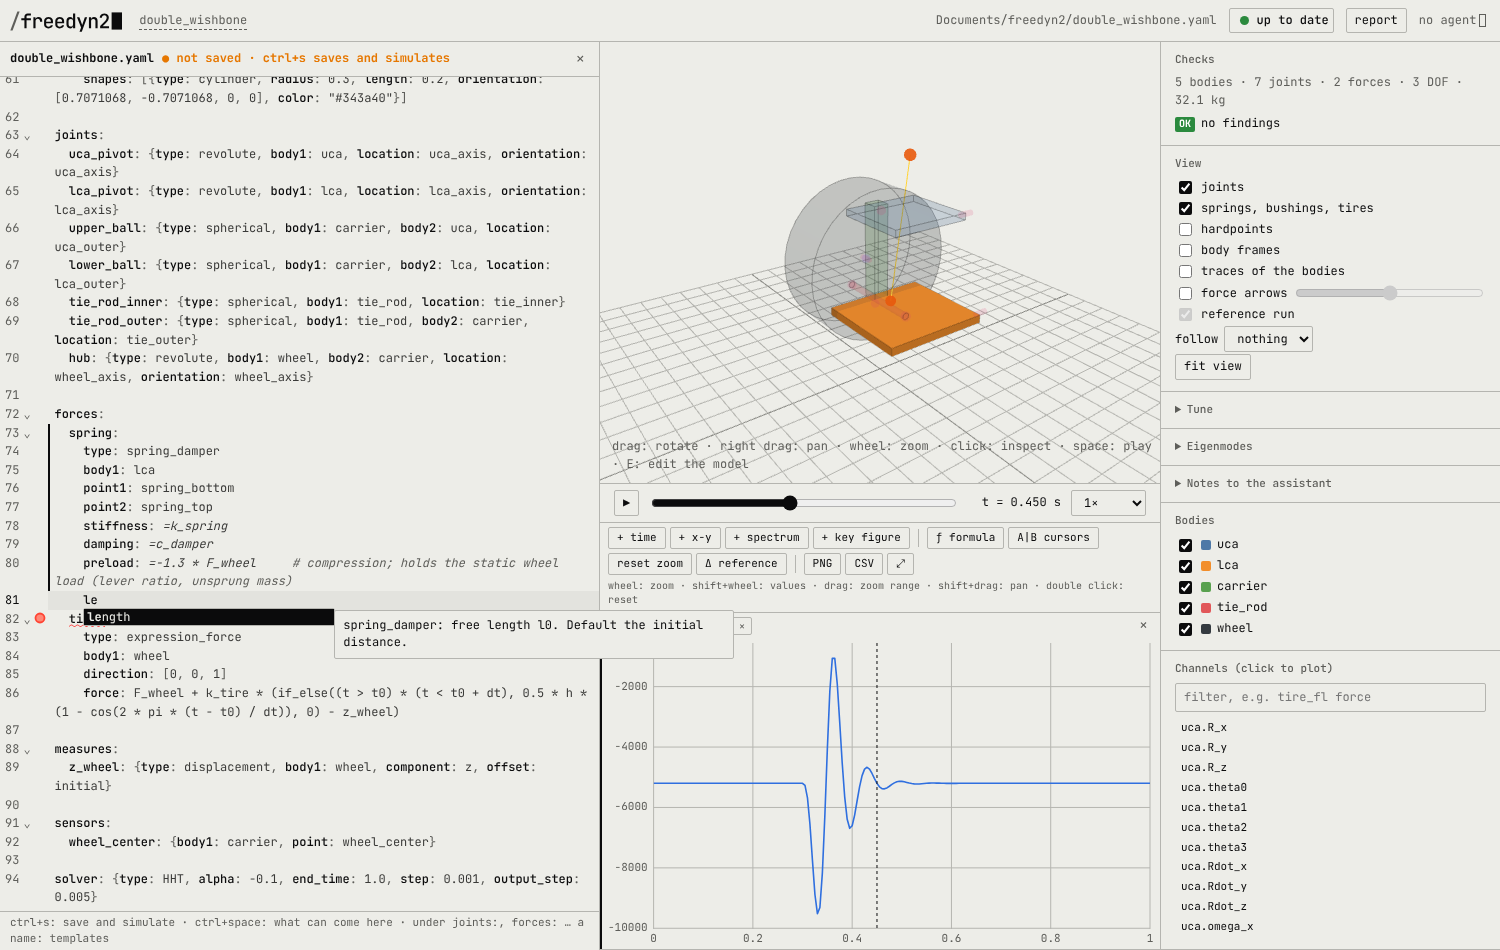
A click on the model name in the header (or the key E) opens the model file in an editor beside the 3D view; so does a click on the YAML text in the inspector (at that element) or on an error. The editor remembers whether it was open.
- Ctrl+S saves and simulates, as a save in any other editor would. Unsaved changes are marked in the editor's header.
- Completion while typing, or with Ctrl+Space: the keys an element can have (required ones
first, those already there left out), the values of a key (
type: rev→revolute), the bodies, points, frames, measures and parameters of the file where they fit (body1:,point1:,orientation:,=in a formula), the parameters, measures and functions in force expressions. - Templates instead of menus: under
bodies:,joints:orforces:, start typing a new name, e.g.revorspring, and pick revolute joint or spring-damper; Tab goes from one field to the next. An empty model file starts as a pendulum. - Errors while typing, at their lines: YAML syntax, the schema (unknown keys, missing ones, wrong values) and the model rules (an unknown body); after a save, the findings of the checks at their elements. Hovering a key shows what it means and the values it takes.
- F2 renames the element under the cursor (on its name or on a reference to it) and every
reference to it, as
freedyn2 renamedoes: only where the name stands, comments stay. It is one change of the text: Ctrl+Z undoes it, Ctrl+S saves it. - Renamed by hand: change the name of an element with an id (an imported one) and the editor sees by the id that it is the same element; it offers to update the references that still have the old name. A file renamed like that in another editor: the header offers the same (Update).
- Linked to the 3D view: the element under the cursor is selected in the 3D view and the inspector; an element clicked in the 3D view is shown in the editor.
- When the file is changed elsewhere (the assistant, another editor), the editor loads it again,
or, with unsaved changes, asks whether to load it or to keep yours. A legacy
.fdsfile is shown read-only;freedyn2 convertmakes a YAML model file of it.
Plots
Below the 3D view (drag the border to resize, ⤢ for large plots):
- over time: all plots share the time axis. Wheel zooms, dragging zooms to a range, shift+drag pans, double click resets. The values of every channel under the mouse; a click sets the time of the animation. Channels of very different size get their own lanes.
- x-y: a channel over another (toe over wheel travel), with a marker at the current time.
- spectrum: the amplitude spectrum of the visible time range, with its peak.
- A|B cursors: values at A and B, the difference, Δt and 1/Δt, min, max, mean and rms between them.
- ƒ formula: channels from formulas, e.g.
v_kmh = hypot(chassis1.Rdot_x, chassis1.Rdot_y) * 3.6ora = der(body.Rdot_z). Functions: sin, cos, tan, asin, acos, atan, atan2, sqrt, abs, exp, log, log10, min, max, hypot, sign, deg, rad, der (time derivative: central differences of the output samples, so it depends onoutput_stepand smooths peaks), int (time integral: trapezoids). The raw accelerations are channels of their own:Rddot_*of the bodies and sensors. - PNG and CSV export of the plots (CSV: the visible time range). Plots and formulas are remembered per model.
Add channels by clicking them in the list (to the active plot, marked at its left edge) or by dragging them onto a plot.
Checks
The Checks panel lists what freedyn2 check finds: errors (inertia no body has, springs of
length zero, non-finite results), likely slips (units, a joint far from its bodies, redundant
constraints, a tire in the air, parameters no expression uses) and what you should know
(degrees of freedom, bodies not connected to the ground, bodies not at rest at the start),
and the references of the model's checks section, passed or failed. Click a finding to
select the element. See Checks and references.
Is the result current?
The header shows whether the results belong to what is set:
| 🟢 up to date | the results are those of the values shown |
| 🟠 N changes not computed | values were changed: the 3D view and the curves fade. Compute ⏎ or Enter computes, discard goes back |
| ▮ computing N % | the new curves grow over the faded ones while the simulation runs (in the cursor color: something is live) |
| 🔴 error | the message, over the last good results |
When to compute is set in Tune: adaptive (by itself when the last run took less than 1.5 s, else on Enter), always, or on Enter. A new computation stops the one still running.
At the right of the header, agent: name▮ says that an assistant opened this viewer over
MCP (tool view of freedyn2 mcp, name as the assistant reports itself): its notes reach the
assistant directly, and the cursor takes the cursor color. no agent for freedyn2 view and
the app; an assistant working in the repository still finds the notes next to the model file.
Tune
The model's parameters get sliders; any other number joins them with a click on it in the
inspector (tune: mass stiffness point1.z …). Fields written as formulas (stiffness:
=k_spring) link to their parameters. Parameters no expression uses are greyed out.
Tuned values are not written into the model file: the server keeps them (until reset all) and applies them to every rebuild. Take them over by editing the file, or send them to the assistant (→ assistant).
Next to each slider: ↺ back to the file's value, ⌁ root locus, ≋ fan.
Runs
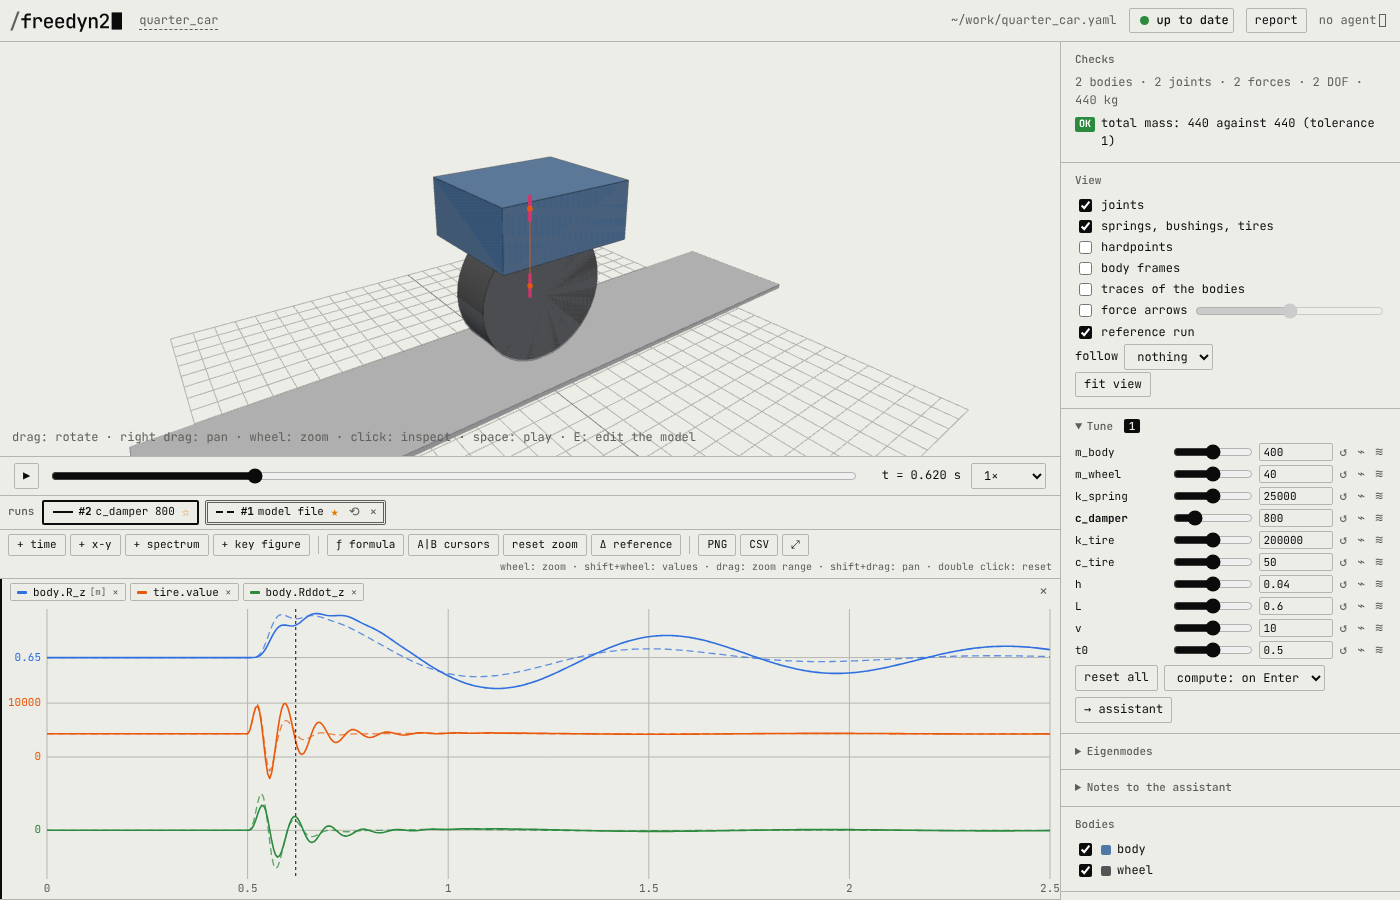
Every simulation is a run in the strip above the plots, labelled with what differs from the model file (tuned values, file v2 after an edit). Click a run to show it dashed in the plots; ☆ makes it the reference (grey bodies in 3D, dashed curves, the base of Δ reference: every run minus the reference); ⟲ takes its values back into Tune; × removes it.
Runs are compared by the names of their channels, so they stay comparable when the model changes between them (a new body, another joint): a channel a run does not have, e.g. that of a body added later, is drawn for the runs that have it and left out for the others (also in Δ reference, where it is shown as it is); bodies missing in the reference run get no grey copy. A renamed element is a new channel.
Fan and key figures
≋ at a slider simulates seven values over its range at once, in parallel: a fan of curves in the time plots, blue for the first value, red for the last; a card in the run strip (progress, show/hide, ×). + key figure adds a plot of a key figure – max, min, max |x|, peak-peak, mean, rms, final – of the channels over the swept value, taken over the visible time range: zoom to an event to get its key figures.
Eigenmodes and root locus
Eigenmodes linearizes the model about the state at the current time and lists frequencies and damping ratios; click a mode to animate it. This is meaningful in an equilibrium or a steady motion (straight running, a steady turn). With live, the eigenvalues follow the sliders at once, before simulating – about the positions and velocities of the current run, with the constraint forces of the changed model.
⌁ at a slider computes the eigenvalues for eleven values over its range: the root locus, real part over frequency, coloured by the value, with lines of equal damping ratio.
Notes to the assistant
Notes to the assistant takes a text; the time, the selected element, the plotted channels,
the tuned values, the eigenmode shown and (optionally) a picture of the view go with it. Notes
are files next to the model (<model>.notes/); the assistant reads them with the MCP tool
notes, answers with answer_note, and the answer appears under your note.
Report and export
Report writes one HTML file with the view, the plots, the checks, the tuned values, the
eigenmodes and the notes – print it to PDF from the browser. freedyn2 view --export page.html
writes the whole viewer with the model and its results into one HTML file that anyone can
open without FreeDyn (the examples on this site are such files).